Clustering Chicago robberies locations with k-means algorithm
Using the real dataset of crimes committed in Chicago, I will divide the robbery locations into a bunch of different clusters. Then I will try to visualize results and answer the question of whether we have chosen well parameters for our algorithm.
Chicago crimes dataset
The internet is full of interesting datasets. This time I want to show you data extracted from the Chicago Police Department's CLEAR (Citizen Law Enforcement Analysis and Reporting) system.
This dataset reflects reported incidents of crime (with the exception of murders where data exists for each victim) that occurred in the City of Chicago from 2001 to present, minus the most recent seven days.
You can read more and download data from kaggle.com
At first, I wanted to predict some results about the narcotics crimes, but it turned out that it's happening everywhere:
Trying to predict narcotics crimes in Chicago ... but I can just assume that everywhere in the city #clustering #MachineLearning 🤔 maybe kidnapping will show more interesting results pic.twitter.com/zi0MelRGBg
— Arkadiusz Kondas (@ArkadiuszKondas) 9 marca 2019
Then another idea came to my head. I will try to have fun and put myself in the role of head of the security officer and plan the deployment of patrol facilities for my new company.
Data preparation and visualization
To simplify the whole process I will use only one file Chicago_Crimes_2012_to_2017.csv
where we can find 1 456 715 records from year 2012 to 2017.
I want to extract only ROBBERY type, and only two columns: Latitude and Longitude:
$handle = fopen('Chicago_Crimes_2012_to_2017.csv', 'r');
$header = fgetcsv($handle);

$lines = [];
$index = 0;
$filter = ['ROBBERY'];
while (($row = fgetcsv($handle)) !== false) {
    if(!in_array($row[6], $filter)) {
        continue;
    }

    if(!is_numeric($row[20]) || !is_numeric($row[21])) {
        continue;
    }

    $lines[] = sprintf('%s;%s', $row[20], $row[21]);
}
fclose($handle);

file_put_contents('robberies.csv', implode(PHP_EOL, $lines));
So let's run this script and check generated file:
➜ head robberies.csv
41.793935909;-87.625680278
41.907274031;-87.722791892
41.851296671;-87.706458801
41.775963639;-87.615517372
41.794879;-87.63179049
41.799461412;-87.596206318
41.989599401;-87.660256868
42.019398729;-87.67543958
42.004487311;-87.679846425
42.009087258;-87.690171862
Everything looks good, but it is always better to try to visualize the data in order to be sure.
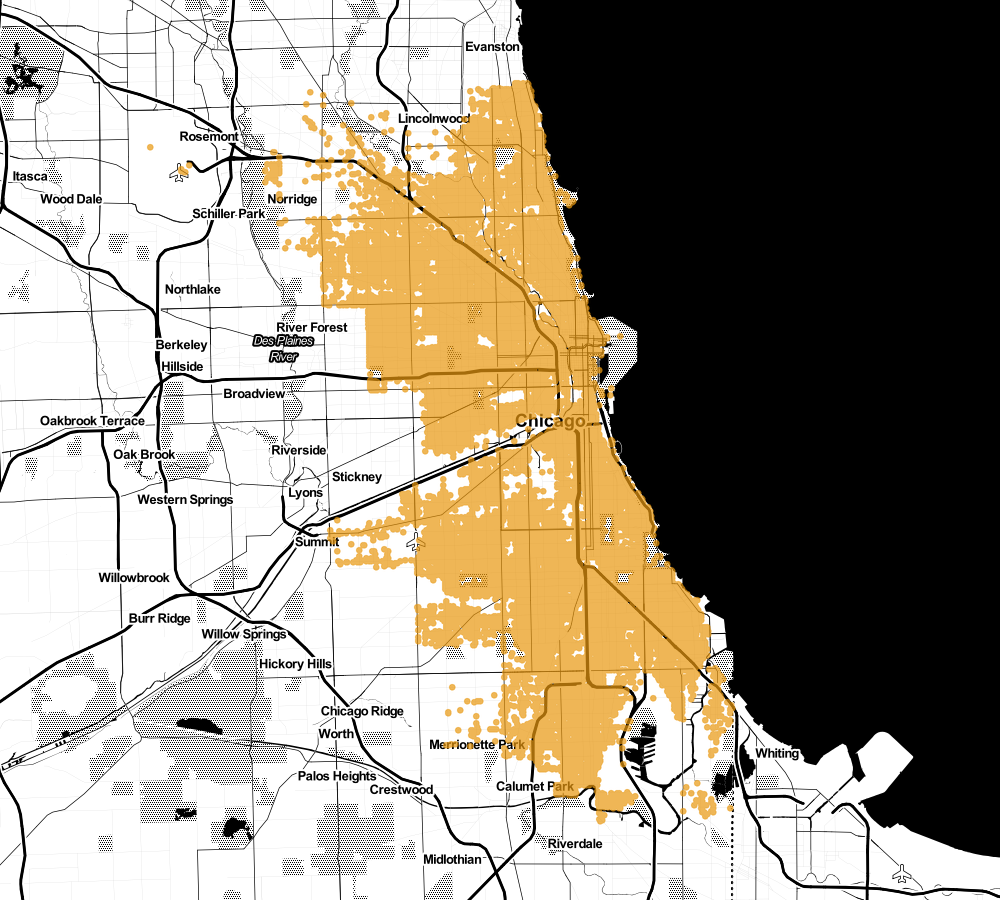
It looks like quite a lot of thugs. As the head of security, I would like to plan my new posts out. Let's see how unsupervised learning can help me solve that problem.
K-means algorithm
To understand the principles of this algorithm, we must introduce one new concept: centroid.
A centroid is a representative of a given cluster or the center of a given group. Now we can split this algorithm in 4 simple steps:
Step 1 Choice the amount of centroids and the initial arrangement of them in space. For this algorithm, we need to predetermine how many groups we want to divide our set. Then we place the number of points in the space ().
The final result depends on the initial placement. Various techniques are used here to optimize its operation.
Step 2 In this step, we calculate the average distances of individual points and assign them to the nearest centroid.
Step 3 We are updating the location of our centroids. The new centroid coordinates are the arithmetic mean of the coordinates of all points having its group.
Final step The second and third steps are repeated until the convergence criterion is reached, which is most often the state in which the membership of the points to the classes has not changed.
You can find graphic visualization of these steps on Naftali Harris blog post: Visualizing K-Means Clustering.
K-means with php-ml
Ok, so you are wondering how to use k-means in php? With php-ml such things are really simple.
use Phpml\Clustering\KMeans;

$clusterer = new KMeans(3);
$clusters = $clusterer->cluster($locations);
In this way, $clusters variable contains array with 3 arrays of our robberies locations.
$locations must be read from csv file prepared earlier:
$locations = file('robberies.csv');
foreach ($locations as &$line) {
    $row = explode(';', $line);
    $line = [(float) $row[0], (float) $row[1]];
}
Stupid simple, but effective. Next I want to save another file with clustered data:
$lines = [];
foreach ($clusters as $key => $cluster) {
    foreach ($cluster as $sample) {
        $lines[] = sprintf('%s;%s;%s', $key, $sample[0], $sample[1]);
    }
}

file_put_contents('robberies-clusters.csv', implode(PHP_EOL, $lines));
So now I have csv file with following structure: clusterIndex;latitude;longitude.
With this simple python script I can create nice visualization map:
import csv
import random
from staticmap import StaticMap, CircleMarker

m = StaticMap(1000, 900, url_template='http://a.tile.stamen.com/toner/{z}/{x}/{y}.png')

def cluster_to_color(cluster):
    alpha = 180
    return {
        '0': (246, 81, 29,alpha),
        '1': (255, 180, 0,alpha),
        '2': (0, 166, 237,alpha),
        '3': (127, 184, 0,alpha),
        '4': (67, 188, 20, alpha),
        '5': (102, 46, 155, alpha),
        '6': (175, 127, 242, alpha),
        '7': (146, 181, 29, alpha),
        '8': (155, 100, 0, alpha),
        '9': (100, 106, 237, alpha),
        '10': (27, 84, 0, alpha),
        '11': (167, 228, 20, alpha),
        '12': (202, 146, 155, alpha),
        '13': (75, 187, 42, alpha)
    }[cluster]

with open('robberies-clusters.csv') as csvfile:
    reader = csv.reader(csvfile, delimiter=';')
    for row in reader:
        marker = CircleMarker((float(row[2]), float(row[1])), cluster_to_color(row[0]), 6)
        m.add_marker(marker)

image = m.render(center=[-87.684871189, 41.8348221989])
image.save('robbery-clusters.png')
Let's plot clustering results on Chicago city map. First k=3
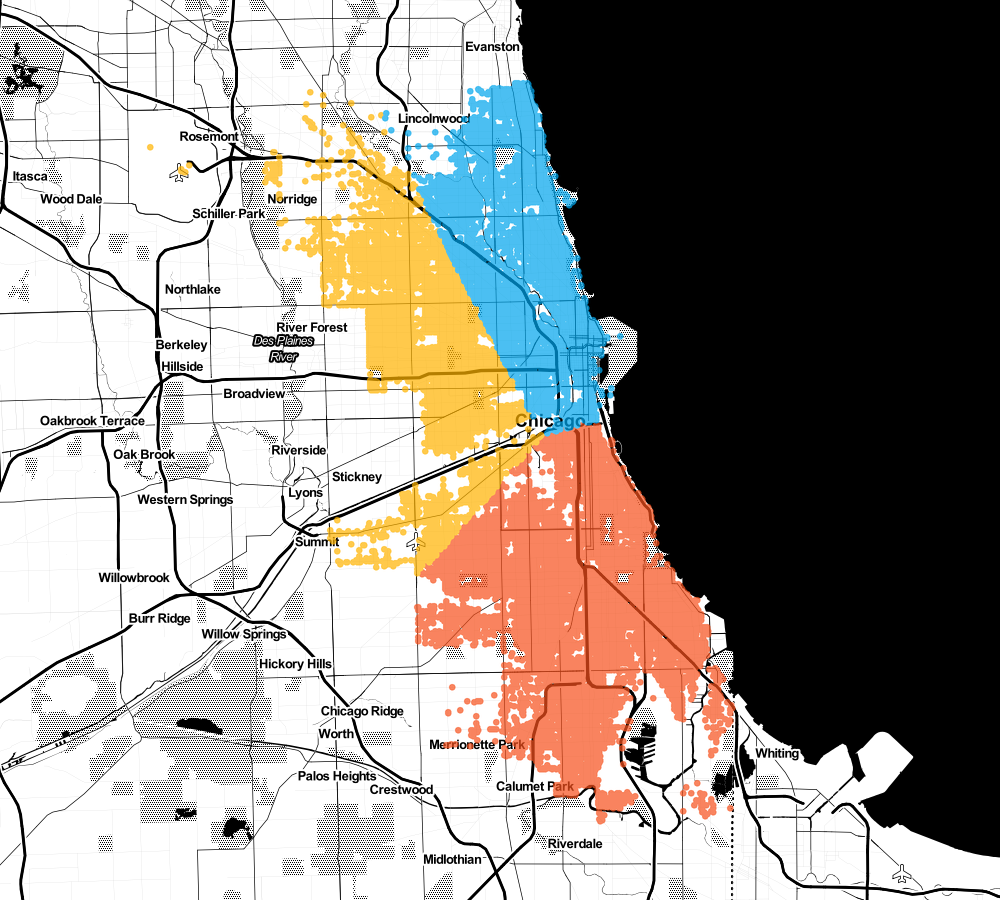
Nothing special, how about adding two more (k=5).
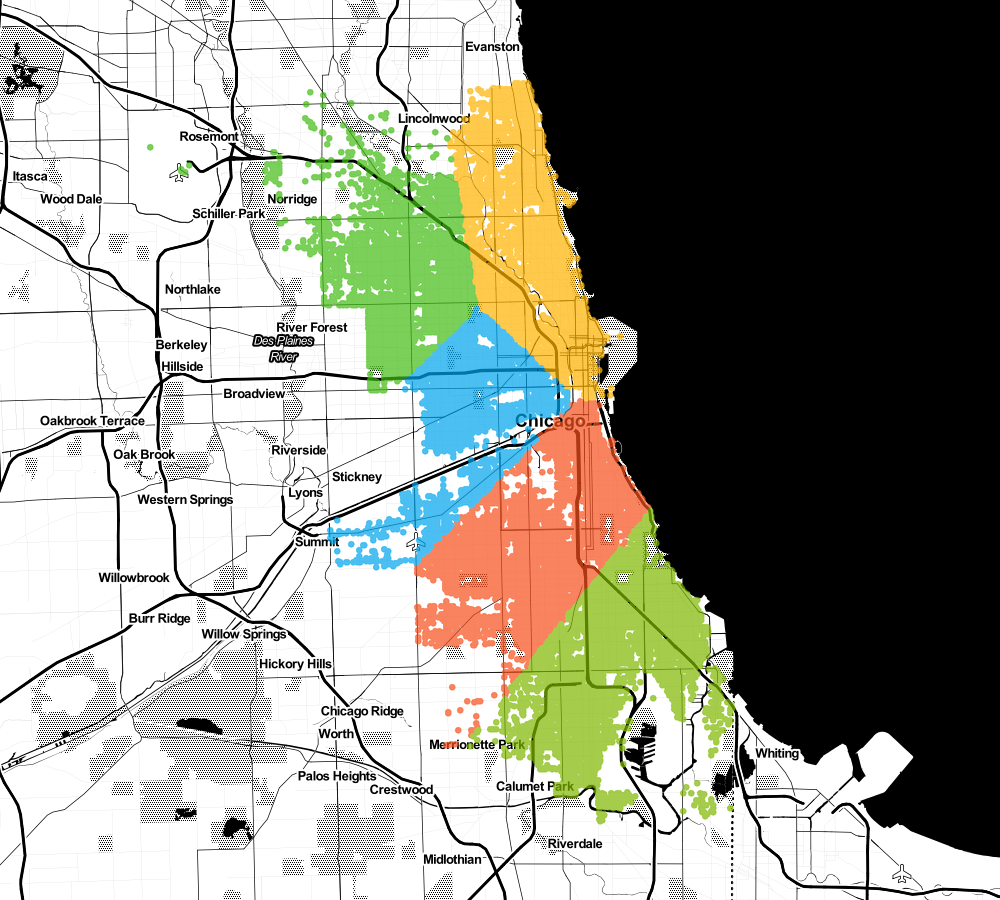
What if I want to build 9 headquarters
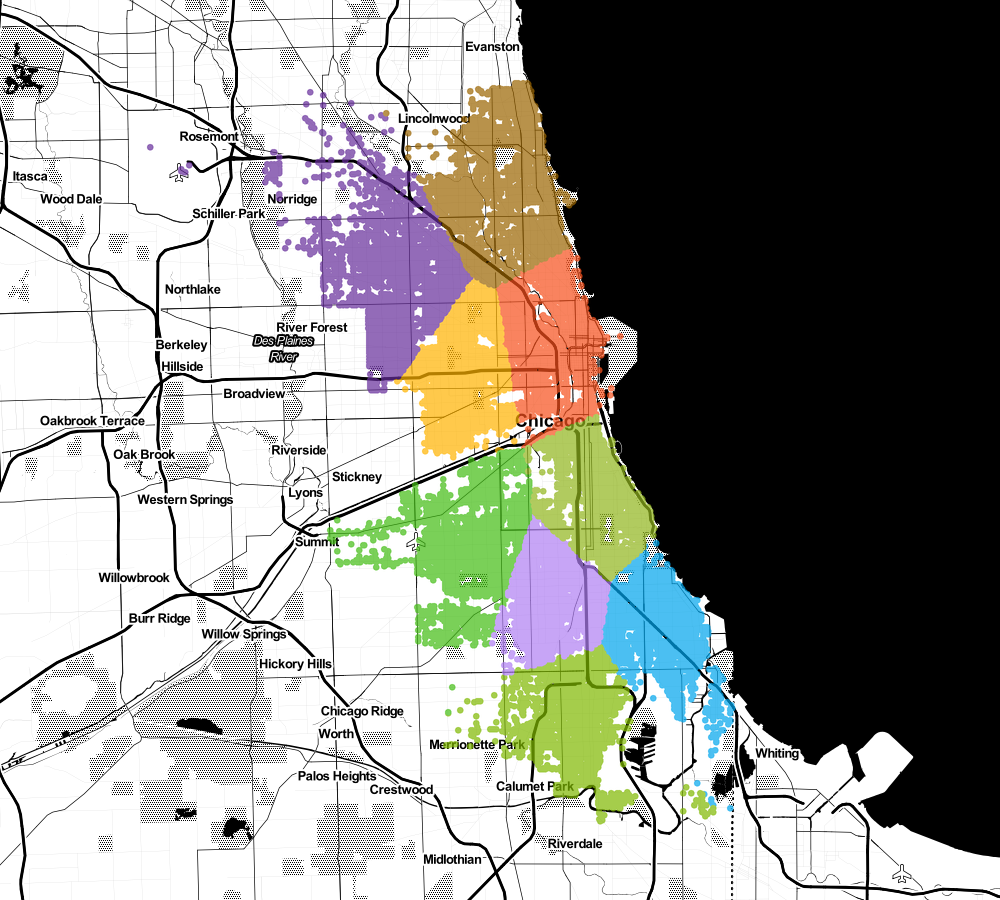
Or maybe even 15?
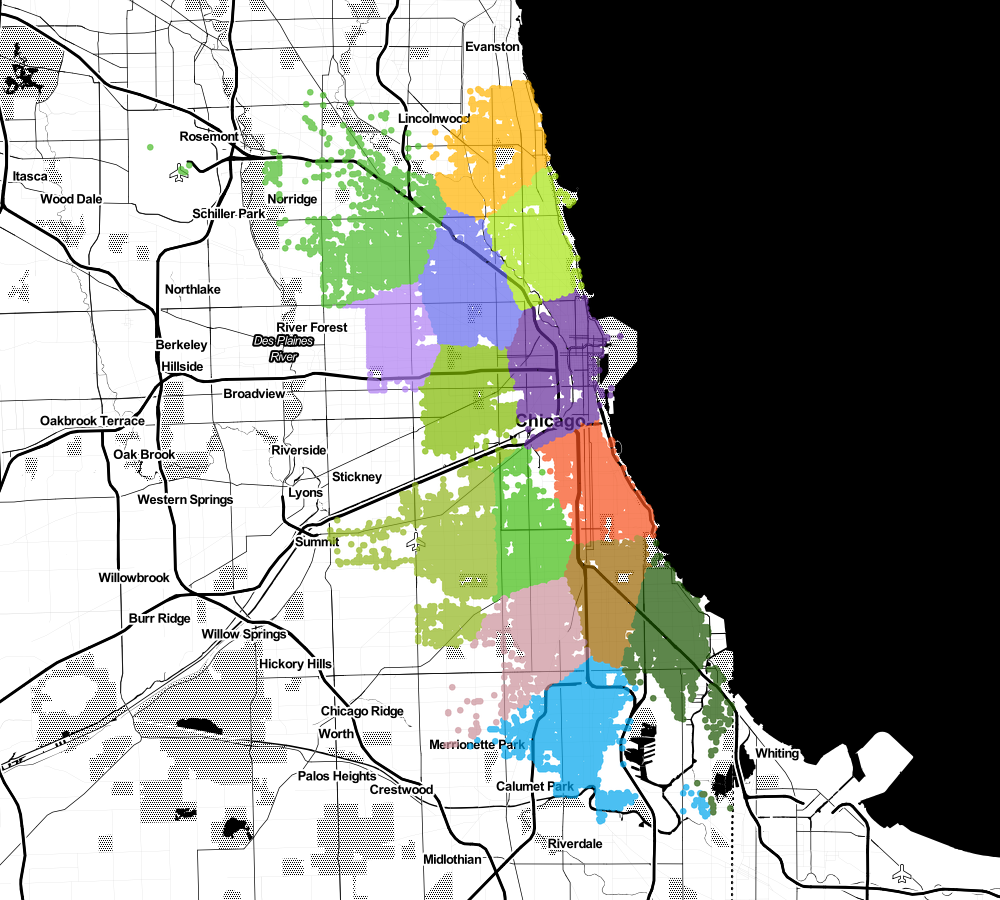
It starts to look interesting, doesn't it? 😉
Choosing best k
One of the main questions that you may encounter while learning this algorithm is: how to choose the best k? The answer is not unambiguous. It may depend on many factors: business, technological or pre-imposes. I would like to show you one more method.
After determining the central points of our clusters, we can count the sum of the distances of all points from this cluster with its center. This method has its name: Error Sum of Squares (SSE)
use Phpml\Math\Distance\Euclidean;

function squaredDistance(array $center, array $cluster): float
{
    $sum = 0;
    $metric = new Euclidean();
    foreach ($cluster as $point) {
        $sum += $metric->sqDistance($center, $point);
    }

    return $sum;
}
Unfortunately, at this point, in php-ml isn't possible to get centroids, you have to do it yourself by overwriting method,
for example KMeans.php
In this way we can calculate SSE for each k from 1 to 20:
for ($i=1; $i<21; $i++) {
    $clusterer = new KMeans($i);
    $clusters = $clusterer->cluster($samples);
    $centronoids = $clusterer->centronoids();

    $sum = 0;
    foreach ($centronoids as $key => $centronoid) {
        $sum += squaredDistances($centronoid, $clusters[$key]);
    }

    echo sprintf('SSE (k=%s): %s' . PHP_EOL, $i, $sum);
}
For robbery dataset we get following results:
SSE (k=1): 556.92954501028
SSE (k=2): 196.07424178192
SSE (k=3): 154.25644889311
SSE (k=4): 112.96452863682
SSE (k=5): 91.08741606063
SSE (k=6): 73.768755748178
SSE (k=7): 62.959303138102
SSE (k=8): 52.128966989257
Let's plot this data, we will be interested in the place where the graph "bends":

As you can see on k=8 (more or less) progress significantly slows down and further clustering makes less sense.
Let's check another dataset. On the University of Eastern Finland,
we can find nice gaussian clusters datasets with varying cluster overlap and dimensions. I begin from visualization:

Now calculate SSE from k=1 to k=20:

In this case, the deflection of the graph is very clear. Note how helpful is the fact that the data can be visualized. For collections with more dimensions, this will no longer be possible.
For the curious one, I prepared one more example with synthetic dataset (small cluster overlap).


Further exploration
In this post, I barely touched the topic of clustering with only one algorithm.
You can find much more information about clustering in Wikipedia.
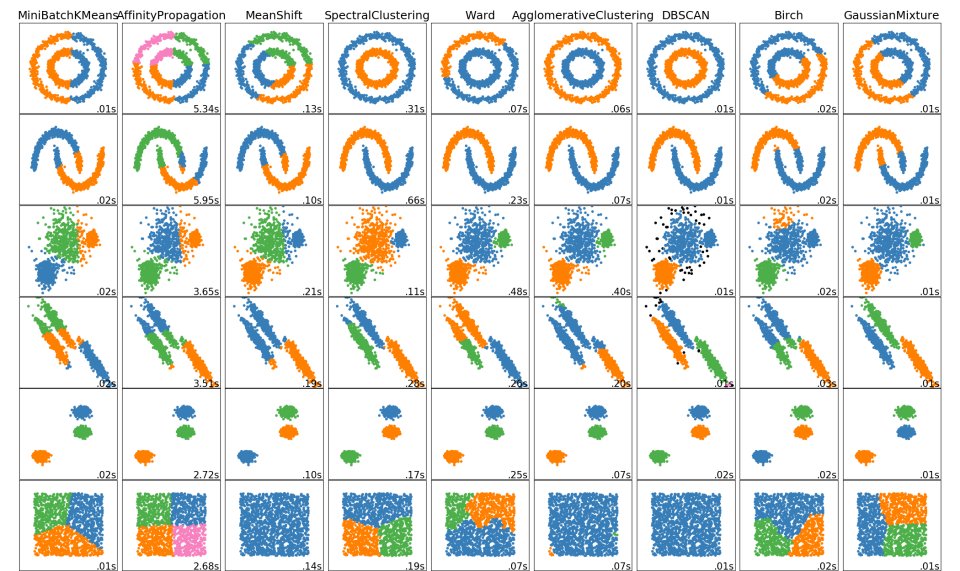
As in the previous post scikit-learn package have also very nice and descriptive website about
clustering.
The comparison between different types of algorithms is very interesting:
There is also a very nice website that can help with k-means visualization http://web.stanford.edu/class/ee103/visualizations/kmeans/kmeans.html
Happy clustering!