Predict air pollution with k-Nearest Neighbors and PHP
Based on air pollution data we will try to predict air quality in a place where we don't have data. I will present k-Nearest Neighbors algorithm and how to implement such prediction in PHP using php-ml.
Disclaimer: In this post I won't predict the future only the current state at place where there is no data. I will write about the forecast's prediction on next posts, so I encourage you to subscribe my newsletter to not leave the topic.
Air pollution
For the purposes of this entry, I will use publicly available data from World Air Quality Index project waqi.info. You can find nice REST API. For example you can grab data for interesting region with simple GET request:
http://api.waqi.info/map/bounds/?token=your-token&latlng=44.74673324024681,4.921875000000001,56.389583525613055,25.664062500000004Example response:
{
  "status": "ok",
  "data": [
    {
      "lat": 51.403007,
      "lon": 7.208546,
      "uid": 6093,
      "aqi": "20"
    },
    {
      "lat": 52.2688736,
      "lon": 10.5267696,
      "uid": 6202,
      "aqi": "11"
    }
  ]
}
A few different figures in response should show that apply some machine learning hangs in the air 🏭.
There is geographic coordinates (lat and lon) and two other values available.
The main parameter that we can try to predict is AQI (aqi from json). What AQI means?
The AQI scale used for indexing the real-time pollution is based on the latest US EPA standard, using the Instant Cast reporting formula.
On Waqi website we can find a nice table with explanations:
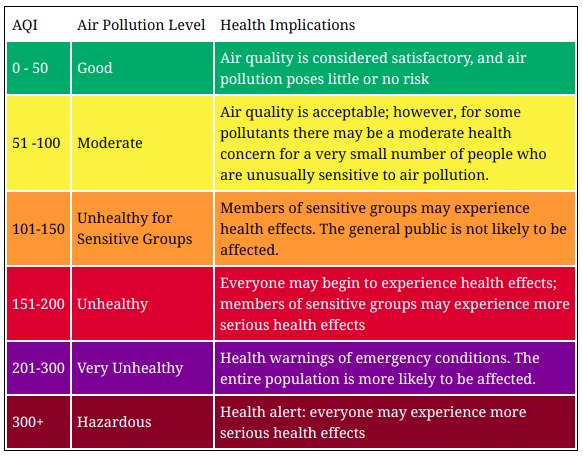
To make the task a bit easier, we will change the numerical values into labels (according to the scale given).
We will also throw out the station number (uid) because wouldn't need it. The whole will be converted to CSV format.
You can view the ready script here aqcin2csv.php, but I encourage you to work independently.
Prepared data should have the following formula:
51.403007;7.208546;good
52.2688736;10.5267696;good
52.235083;5.181552;good
47.5292;9.9267;good
47.9704873;17.7852936;moderate
51.4625;13.526666666667;moderate
48.7344444;19.1128073;good
As you can see, preliminary data preparation is also part of the tedious work of date scientist. Sometimes you have to work a lot to have the right to watch fireworks. Sometimes, despite the hard work, the show is gone 😔.
But it is worth trying, even path to the goal can teach a lot and give even more satisfaction than the goal itself.
The data is already pre-processed, we can go to discuss the algorithm.
k-Nearest Neighbors
The algorithm of k-Nearest Neighbors it's a pretty simple algorithm for classification (supervised learning).
Principle of its operation consists in determining k nearest neighbors of the searched value.
The search is usually based on some metrics. In this case, it will be a distance measure.
Based on the neighbors found, it is able to assign the appropriate label for the data you are looking for.
We choose the most frequently appearing, from among found k neighbors.
In our case, the label we are looking for will be one of the following values:
good, moderate, unhealthy for sensitive, unhealthy, very unhealthy or hazardous.
The input data gonna be geographical coordinates, for example: 51.403007 and 7.208546.
You can find input data in this file: air.csv (712 samples).
Before we start to play, we still have one more important thing to do.
Visualization
I believe that visualization is one of the most powerful means of achieving personal goals. [Harvey Mackay]
One of the basic skills of a data scientist is data visualization. A good data visualization. Let's see what the data from the csv file looks like on the map (aqcin.py).
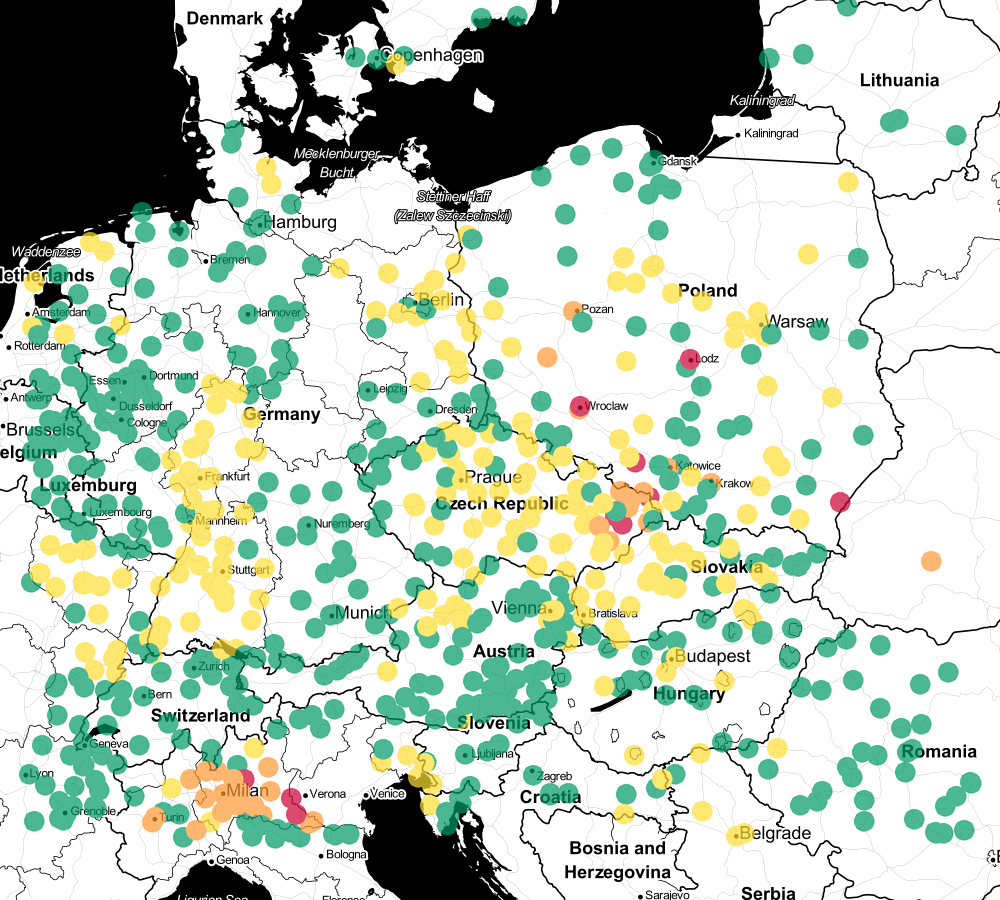
As you can see, we can distinguish clear clusters of good and bad air. Therefore, k-Nearest Neighbors should be fit for classification.
Prediction with PHP-ML
Train and predict script with php-ml is very simple:
use Phpml\Classification\KNearestNeighbors;
use Phpml\Dataset\CsvDataset;

$estimator = new KNearestNeighbors();
$estimator->train($dataset->getSamples(), $dataset->getTargets());
$predicted = $estimator->predict([$sample]);
but today I will try to explore our collection more closely.
We are start from trying to predict air quality for each point (without itself) based on its selected neighbors.
In addition, I also want to measure its correctness for different k (the number of nearest neighbors). Let's write
a script for range from k=1 to k=10:
use Phpml\Classification\KNearestNeighbors;
use Phpml\Dataset\CsvDataset;

require 'vendor/autoload.php';

$dataset = new CsvDataset('air.csv', 2, false, ';');

foreach (range(1, 10) as $k) {
    $correct = 0;
    foreach ($dataset->getSamples() as $index => $sample) {
        $estimator = new KNearestNeighbors($k);
        $estimator->train($other = removeIndex($index, $dataset->getSamples()), removeIndex($index, $dataset->getTargets()));

        $predicted = $estimator->predict([$sample]);

        if ($predicted[0] === $dataset->getTargets()[$index]) {
            $correct++;
        }
    }

    echo sprintf('Accuracy (k=%s): %.02f%% correct: %s', $k, ($correct / count($dataset->getSamples())) * 100, $correct) . PHP_EOL;
}

function removeIndex($index, $array): array
{
    unset($array[$index]);
    return $array;
}
Are you curious about the results? 🤔
Accuracy (k=1): 72.19% correct: 514
Accuracy (k=2): 71.63% correct: 510
Accuracy (k=3): 74.44% correct: 530
Accuracy (k=4): 72.05% correct: 513
Accuracy (k=5): 74.30% correct: 529
Accuracy (k=6): 73.46% correct: 523
Accuracy (k=7): 74.02% correct: 527
Accuracy (k=8): 74.44% correct: 530
Accuracy (k=9): 75.84% correct: 540
Accuracy (k=10): 74.44% correct: 530
As you can see k=9 has the most hits. Unfortunately, the values themselves don't show much information about our model.
In order to visualize this, we will predict the result for the whole point grid. We can do it with a simple script:
use Phpml\Classification\KNearestNeighbors;
use Phpml\Dataset\CsvDataset;
require 'vendor/autoload.php';
$minLat = 41.34343606848294;
$maxLat = 57.844750992891;
$minLng = -16.040039062500004;
$maxLng = 29.311523437500004;
$step = 0.1;
$k = 1;
$dataset = new CsvDataset('air.csv', 2, false, ';');
$estimator = new KNearestNeighbors($k);
$estimator->train($dataset->getSamples(), $dataset->getTargets());
$lines = [];
for($lat=$minLat; $lat<$maxLat; $lat+=$step) {
for($lng=$minLng; $lng<$maxLng; $lng+=$step) {
$lines[] = sprintf('%s;%s;%s', $lat, $lng, $estimator->predict([[$lat, $lng]])[0]);
}
}
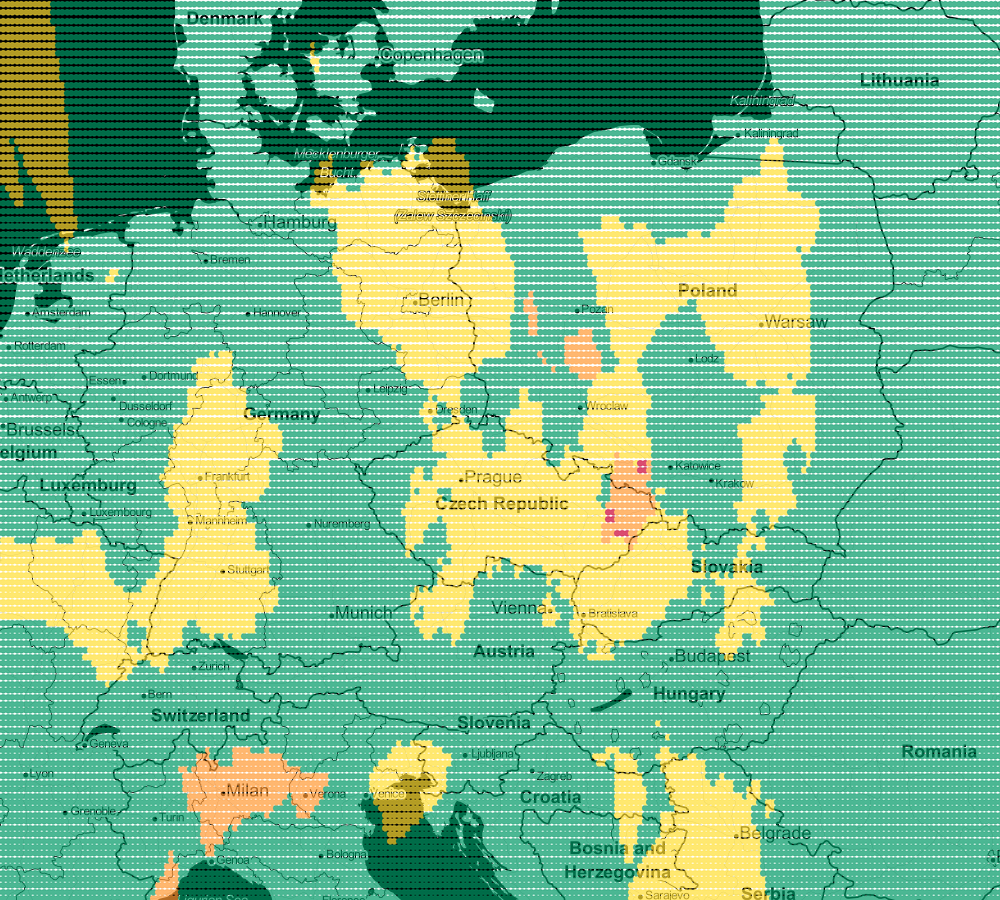
file_put_contents('airGrid.csv', implode(PHP_EOL, $lines));Let's see what the visualization of prediction looks like for k=1
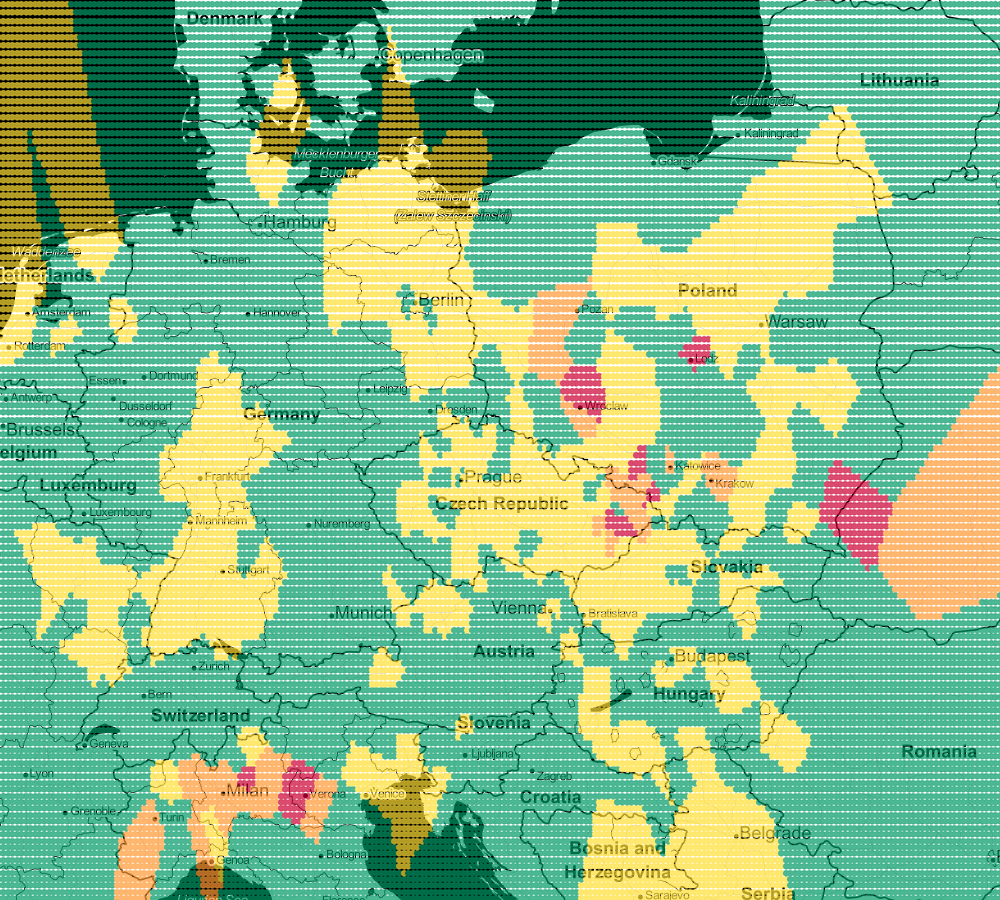
We see lots of abrupt changes from one color to another with sharp boundaries.
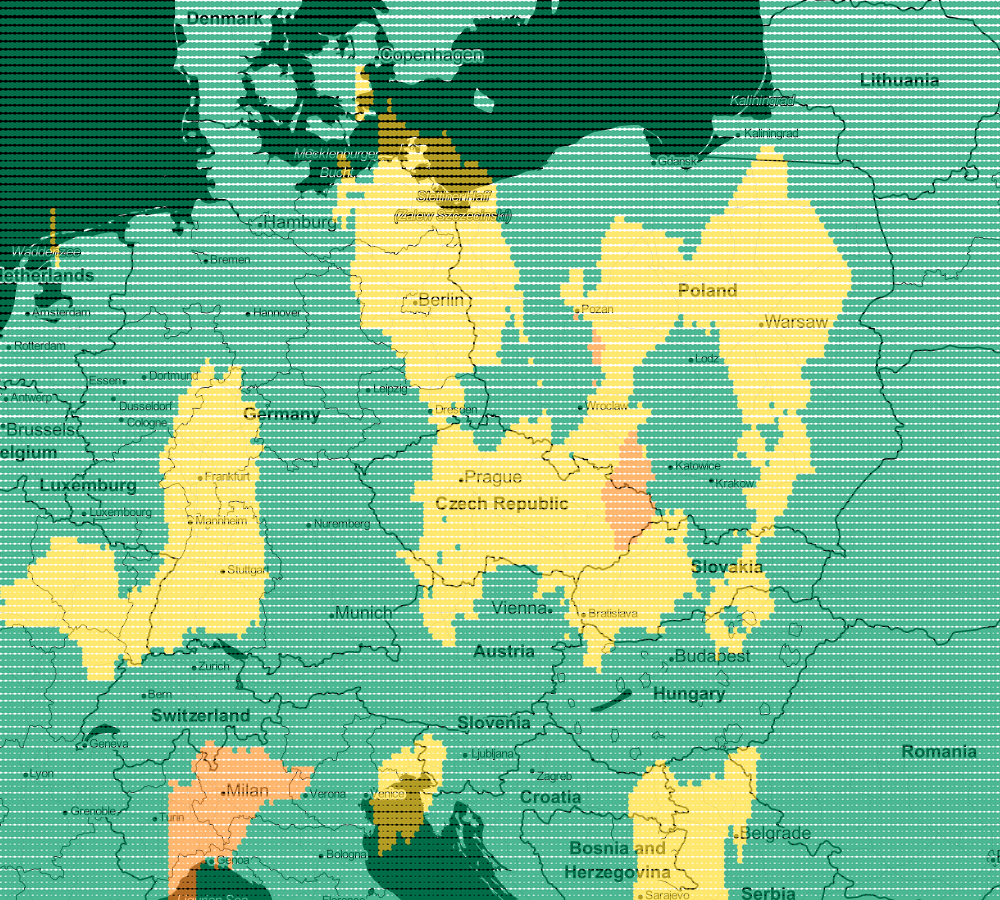
As we increase the number of neighbors to k=3, we see smoother regions for each color (air quality).
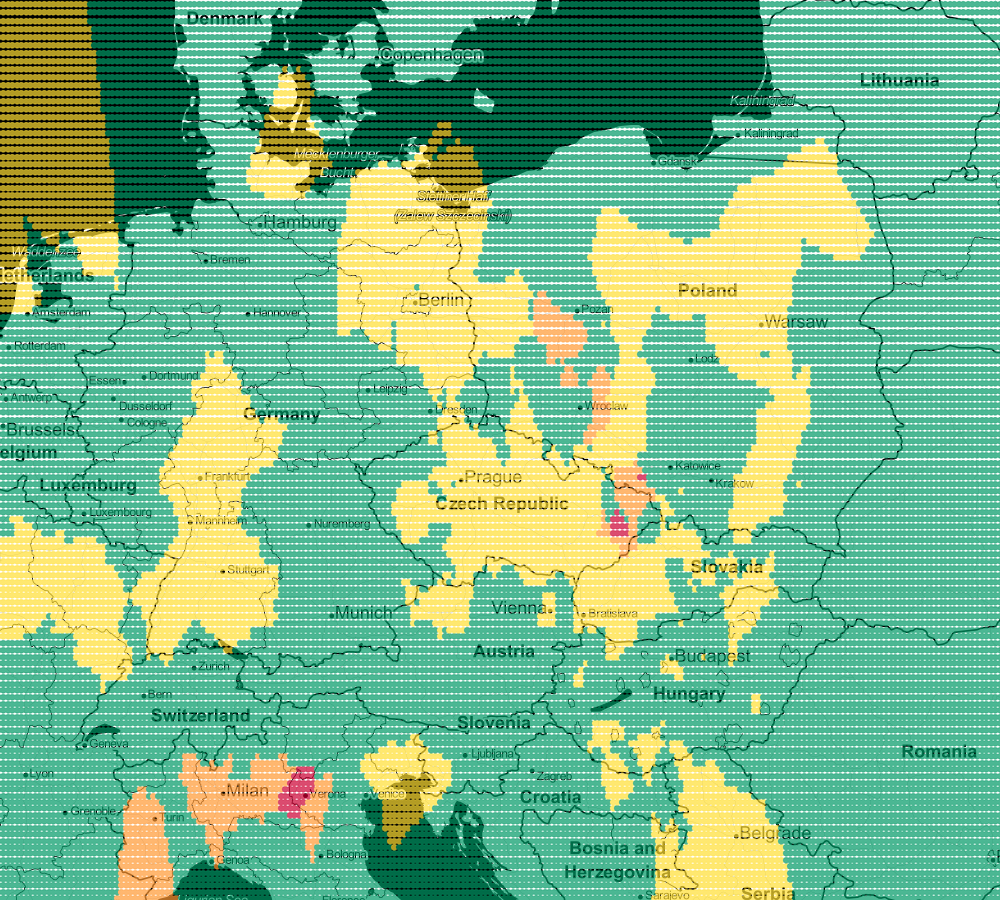
Following this trail, we can generate more maps. Next for k=5 and k-9:
In this way, you can visualize your model. Every model works a little differently but the map will let you choose the one that suits you best. Remember that very often there is no unambiguous answer.
The sheer number of neighbors is not all possibilities of change. You can still change the way in which we count the distance between points.
use Phpml\Math\Distance\Minkowski;
use Phpml\Classification\KNearestNeighbors;

$estimator = new KNearestNeighbors($k, new Minkowski());
I leave you the pleasure of further exploration. 😉
The Curse of Dimensionality
I hope that in this way you already understand how the algorithm of k-Nearest Neighbors works. However, it have a significant problem.
First, the visualization of larger numbers of dimensions is quite troublesome (3 is still sensible).
The second is a feature of multidimensional spaces called Curse of Dimensionality. Points in such spaces are more
distant from each other the more dimensions we have.
To better understand this we will generate random points (10000 pairs) in subsequent spaces: from 1 dimension to 300 dimensions 🤯.
For each such space, we calculate the average and minimum distance of these points.
use Phpml\Math\Distance\Euclidean;
use Phpml\Math\Statistic\Mean;

$dimensions = range(1, 300);
$pointsCount = 10000;
$metric = new Euclidean();

foreach ($dimensions as $dimension) {
    $distances = [];
    for ($i = 0; $i < $pointsCount; $i++) {
        $distances[] = $metric->distance(randomPoint($dimension), randomPoint($dimension));
    }

    echo Mean::arithmetic($distances) . ';' . min($distances) . PHP_EOL;
}

function randomPoint(int $dimensions): array
{
    return array_map(function($index){
        return random_int(1, 10);
    }, range(1, $dimensions));
}
Then we will carry the results on the graph:

As you can see as the amount of dimensions increases, the average and minimum distance between points also increases. We can say that multidimensional spaces are less dense or simply more extensive (for the same amount of data).
We can imagine it differently. Let's see how the same amount of randomly generated points looks in two- and three-dimensional space.

Adding the next space to the same amount of data means that their distances from each other increase.

For this reason, if you intend to use k-Nearest Neighbors with a collection of data with a large number of features, it is probably a good idea to use some sort of dimensional reduction algorithm first.
Where to explore more
If you are still hungry about the counting of neighbors then you can read a very good entry from the documentation
of the scikit-learn package: Nearest Neighbors
In this post, I used the brute force method to predict results, but there is much better and faster implementation using the k-d tree algorithm. I will try to describe it in the next post. Not necessarily the next one. Subscribe to my newsletter if you don't want to miss post that you are interested in.
Enjoy your Nearest Neighbors.